Launched Histogram.dev 🎉
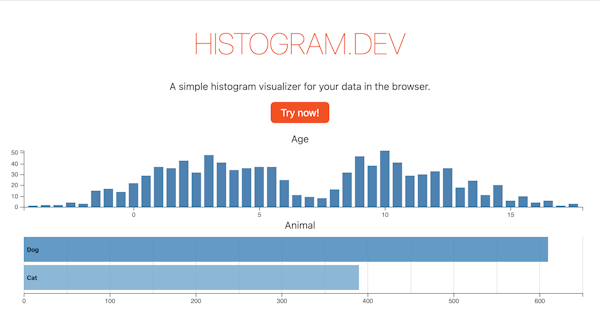
Today marks the first public release of histogram.dev. This is a project I've been working on for a short while now. Simply drag & drop a CSV onto the dashboard page to generate your histograms. Numeric charts can be filtered by clicking and dragging over a region. Non-numeric charts can be filtered by clicking rows you want to include.
Tech stack
- Golang
- Svelte
- Crossfilter
- d3.js
- AWS ECS
- Cloudflare
Possible features
- A Pandas extension to allow plotting from inside your dataframe workflows
- Perma-links to allow saving/sharing your charts
- Random sampling (easier processing of large data)
Current limitations
- Only the first 3000 records & 8 features are used