My name is Pete, and I am a graph-o-holic.
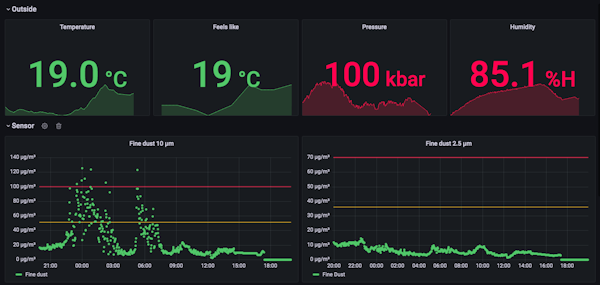
It started a few weeks ago with The Festival of Curiosity workshop on creating an air quality sensor. I quickly discovered I could send the data to InfluxData and visualise it with Grafana Labs. Since then, I've been unable to stop.
I've started creating graphs for everything and anything I can - the house's temperature stats, local weather, IoT power plugs, the internet connection and obviously the air quality sensor.
Now, I'm starting to figure out how I can get the data out of the smart electricity meter, once it arrives.
Please send help, or some more data to create a graph with.